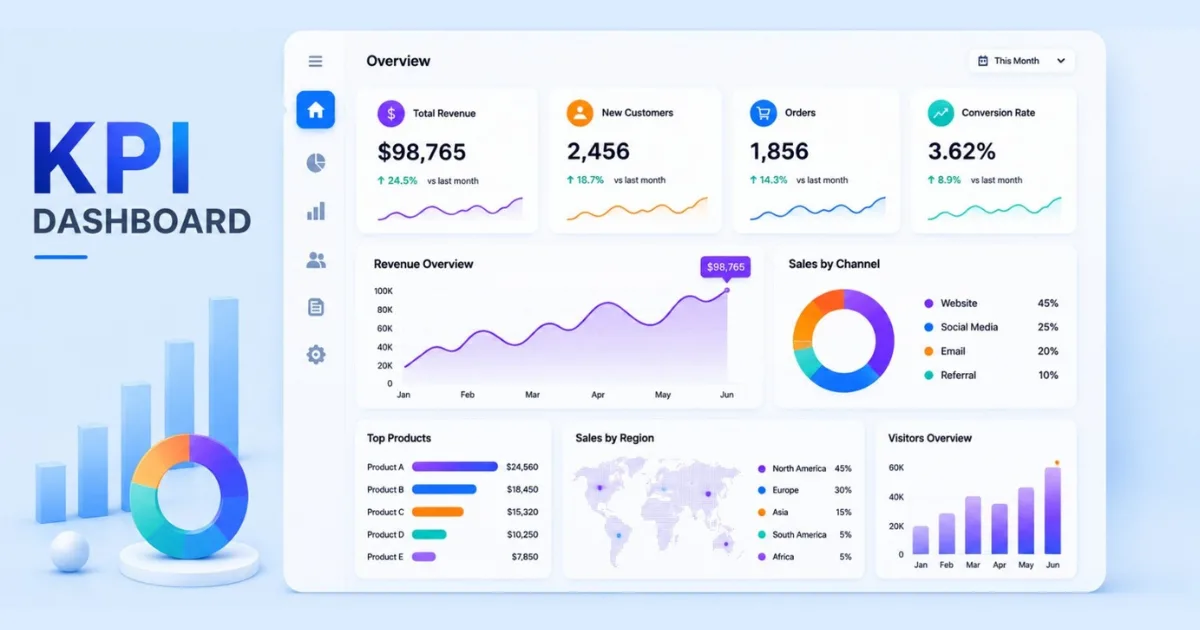
Businesses generate more data than ever before, but data alone doesn't improve performance. The real value comes from understanding what the numbers mean and acting on them quickly. That's where a KPI dashboard becomes essential. Instead of checking multiple reports, teams can monitor their most important metrics from one central location, making faster and more informed decisions.
Whether you're tracking sales, marketing campaigns, customer support, or business operations, a KPI dashboard helps you stay focused on the metrics that matter most.
What Is a KPI Dashboard?
A KPI (Key Performance Indicator) dashboard is a visual reporting tool that displays the most important business metrics in real time. It combines charts, graphs, and scorecards to help teams measure progress toward specific goals without digging through spreadsheets.
For example, a marketing team may track website traffic, lead generation, conversion rate, and advertising ROI, while a sales team focuses on revenue, pipeline value, and win rate.
For example:
- A marketing team can monitor website traffic, conversion rate, ad spend, and lead generation.
- A sales team can track revenue, monthly sales, deal pipeline, and sales targets.
- A customer support team can monitor response time, customer satisfaction, and ticket resolution.
The main purpose of a KPI Dashboard is to turn complex business data into simple visual insights that everyone can understand.
Key Benefits of a KPI Dashboard
Using a KPI dashboard offers several advantages:
- Monitor business performance in real time.
- Spot trends and issues before they become bigger problems.
- Improve decision-making with clear visual insights.
- Save time by reducing manual reporting.
- Keep teams aligned with shared business goals.
Common KPI Dashboard Examples
Different teams require different dashboards. Some popular examples include:
- Marketing Dashboard: Website traffic, campaign performance, and customer acquisition.
- Sales Dashboard: Revenue, sales pipeline, conversion rate, and monthly targets.
- Customer Support Dashboard: Response time, ticket resolution, and customer satisfaction.
- Executive Dashboard: Company-wide KPIs for strategic decision-making.
Best Practices for Building an Effective KPI Dashboard
To get the most value from your dashboard:
- Track only metrics that support business objectives.
- Keep the design clean and easy to understand.
- Update data automatically whenever possible.
- Use consistent charts and visual indicators.
- Review KPIs regularly as business priorities evolve.
Final Thoughts
A well-designed KPI dashboard turns complex data into meaningful business insights. By focusing on the right metrics, organizations can improve productivity, identify growth opportunities, and make smarter decisions with confidence. Whether you're a small business or a growing enterprise, investing in an effective KPI dashboard is a practical step toward better performance and long-term success.